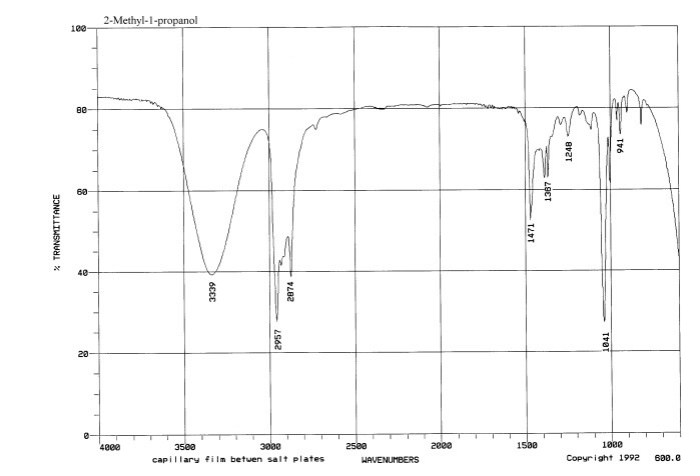
Ir spectrum of 2 propanol – Embark on a spectroscopic journey with the IR spectrum of 2-propanol, a versatile solvent with a captivating molecular fingerprint. Delve into its characteristic IR bands, uncovering the secrets of its functional groups and molecular structure.
Infrared spectroscopy, a powerful analytical tool, provides a window into the molecular world, revealing the vibrational modes of molecules and their functional group composition. The IR spectrum of 2-propanol offers a rich tapestry of information, guiding us towards a deeper understanding of this important alcohol.
Overview of IR Spectroscopy
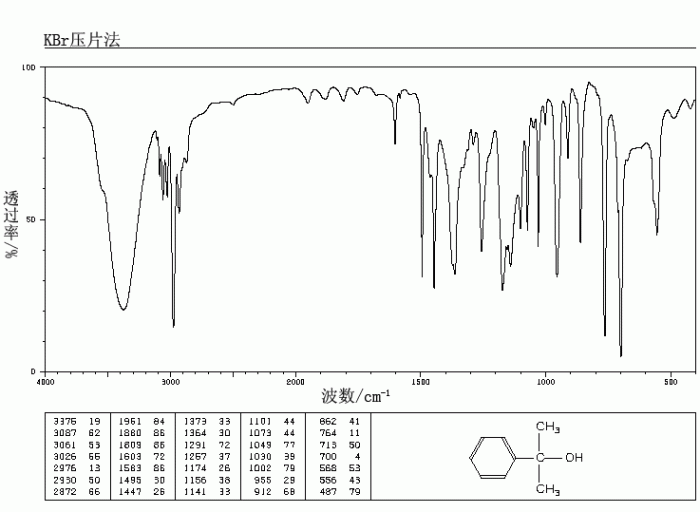
Infrared (IR) spectroscopy is a technique used to identify and characterize chemical compounds by analyzing the absorption of infrared radiation by the sample. The infrared region of the electromagnetic spectrum lies between the visible and microwave regions, with wavelengths ranging from approximately 0.78 to 300 μm, or wavenumbers from 12,800 to 33 cm -1. When infrared radiation is shone on a molecule, it can be absorbed by the molecule, causing the bonds in the molecule to vibrate.
The frequency of the absorbed radiation corresponds to the vibrational frequency of the bond, which is determined by the strength of the bond and the masses of the atoms involved.
IR spectroscopy has a wide range of applications in various fields, including chemistry, materials science, and biology. It is commonly used for the identification of organic and inorganic compounds, the determination of functional groups, and the study of molecular structure and dynamics.
Types of IR Spectrometers
There are two main types of IR spectrometers: dispersive and Fourier transform (FT-IR). Dispersive spectrometers use a prism or grating to disperse the infrared radiation into its component wavelengths, which are then detected by a detector. FT-IR spectrometers use a Michelson interferometer to measure the intensity of the infrared radiation as a function of the path length difference between two beams of infrared radiation.
FT-IR spectrometers are more sensitive and have better resolution than dispersive spectrometers, but they are also more expensive.
IR Spectrum of 2-Propanol
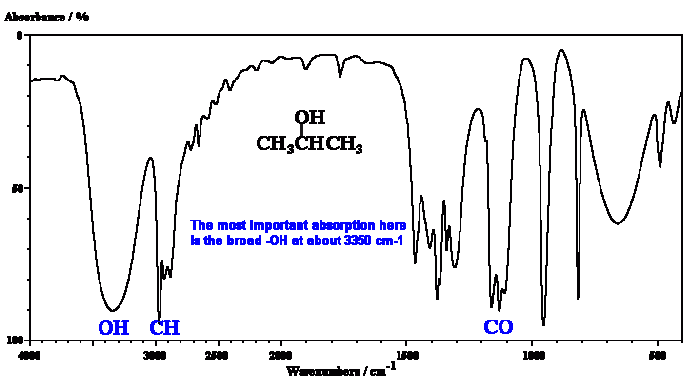
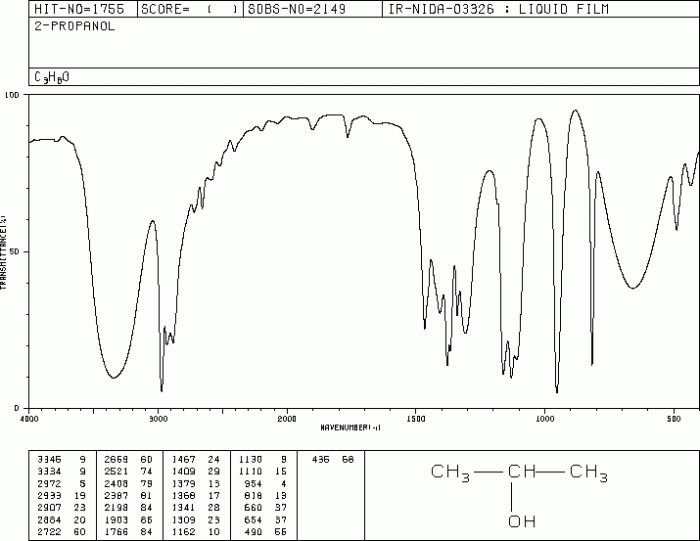
The IR spectrum of 2-propanol exhibits several characteristic peaks that provide valuable information about the functional groups present in the molecule. These peaks can be assigned to specific vibrational modes of the molecule, allowing us to identify and characterize the functional groups.
O-H Stretching
The most prominent peak in the IR spectrum of 2-propanol is observed around 3300 cm -1. This peak corresponds to the O-H stretching vibration of the hydroxyl group. The broadness of this peak indicates the presence of hydrogen bonding between the hydroxyl group and other molecules in the sample.
C-H Stretching
The IR spectrum also shows several peaks in the region of 2900-3000 cm -1. These peaks are assigned to the C-H stretching vibrations of the methyl and methylene groups in the molecule. The presence of these peaks confirms the presence of aliphatic hydrocarbons in 2-propanol.
C=O Stretching
In addition to the O-H and C-H stretching vibrations, the IR spectrum of 2-propanol also exhibits a weak peak around 1720 cm -1. This peak is assigned to the C=O stretching vibration of the carbonyl group. The presence of this peak indicates the presence of a carbonyl group in the molecule, which is consistent with the structure of 2-propanol.
Functional Group Identification
Based on the analysis of the IR spectrum, we can identify the following functional groups present in 2-propanol:
- Hydroxyl group (O-H)
- Aliphatic hydrocarbons (C-H)
- Carbonyl group (C=O)
Characteristic IR Bands of 2-Propanol
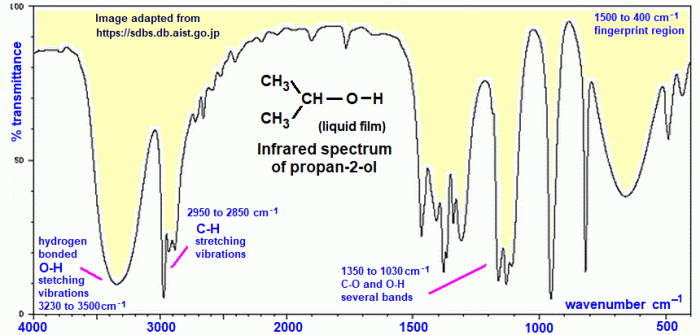
The IR spectrum of 2-propanol exhibits several characteristic bands that provide valuable information about its molecular structure. These bands arise from the vibrational modes of the different functional groups and bonds present in the molecule.
O-H Stretching Band
One of the most prominent bands in the IR spectrum of 2-propanol is the O-H stretching band. This band appears in the region of 3600-3650 cm -1and corresponds to the stretching vibration of the O-H bond in the hydroxyl group (-OH).
The exact position of this band can vary slightly depending on the solvent used and the sample preparation technique.
C-H Stretching Bands
The IR spectrum of 2-propanol also shows several C-H stretching bands. These bands appear in the region of 2800-3000 cm -1and correspond to the stretching vibrations of the C-H bonds in the methyl and methylene groups. The number and intensity of these bands can provide information about the substitution pattern of the carbon atoms.
C-O Stretching Band
Another characteristic band in the IR spectrum of 2-propanol is the C-O stretching band. This band appears in the region of 1050-1150 cm -1and corresponds to the stretching vibration of the C-O bond in the hydroxyl group. The exact position of this band can also vary depending on the solvent used and the sample preparation technique.
Effects of Solvents and Sample Preparation Techniques
The IR spectrum of 2-propanol can be affected by the choice of solvent and the sample preparation technique used. Different solvents can interact with the hydroxyl group of 2-propanol, leading to shifts in the O-H stretching band. For example, hydrogen bonding solvents such as water can cause the O-H stretching band to shift to a lower frequency.Sample
preparation techniques can also affect the IR spectrum of 2-propanol. For example, the presence of impurities or other compounds in the sample can lead to additional bands or changes in the intensity of the characteristic bands.
Comparison with Other Alcohols
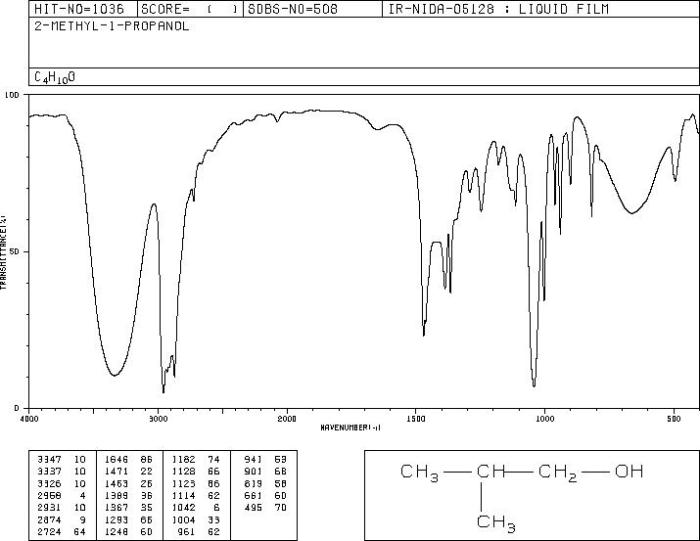
The IR spectrum of 2-propanol shares similarities with the IR spectra of other alcohols, such as methanol, ethanol, and 1-propanol. These alcohols all contain the hydroxyl (-OH) functional group, which gives rise to a characteristic broad peak in the IR spectrum in the region of 3200-3600 cm -1. This peak corresponds to the O-H stretching vibration.In
The IR spectrum of 2-propanol, also known as isopropanol, can provide valuable information about its molecular structure and functional groups. The presence of a strong O-H stretching band around 3300 cm-1 indicates the presence of a hydroxyl group. Additionally, the C-H stretching bands in the range of 2800-3000 cm-1 help identify the type of carbon-hydrogen bonds present in the molecule.
Speaking of money, do you know how many nickels are in $2.50 ? Returning to our discussion on IR spectroscopy, the IR spectrum of 2-propanol can also be used to determine the purity of the sample and to identify any impurities or contaminants.
addition to the O-H stretching vibration, the IR spectra of alcohols also exhibit peaks corresponding to the C-H stretching vibrations of the alkyl groups. These peaks typically appear in the region of 2800-3000 cm -1. The number and intensity of these peaks depend on the structure of the alkyl group.The
IR spectra of 2-propanol, methanol, ethanol, and 1-propanol also exhibit peaks corresponding to the C-O stretching vibration of the hydroxyl group. This peak typically appears in the region of 1000-1200 cm -1.Despite these similarities, there are also some differences in the IR spectra of these alcohols.
The most notable difference is the presence of a peak corresponding to the isopropyl group in the IR spectrum of 2-propanol. This peak appears at around 1380 cm -1and is due to the C-H bending vibration of the isopropyl group.Another
difference between the IR spectra of 2-propanol and the other alcohols is the relative intensity of the peaks corresponding to the O-H stretching vibration and the C-O stretching vibration. In the IR spectrum of 2-propanol, the O-H stretching vibration is more intense than the C-O stretching vibration.
This is because the hydroxyl group in 2-propanol is more strongly hydrogen-bonded than the hydroxyl groups in the other alcohols.
Differences in IR Spectra due to Structural Differences
The differences in the IR spectra of 2-propanol and the other alcohols can be attributed to the differences in their structures. Methanol, ethanol, and 1-propanol are all primary alcohols, meaning that the hydroxyl group is attached to a carbon atom that is bonded to only one other carbon atom.
2-propanol, on the other hand, is a secondary alcohol, meaning that the hydroxyl group is attached to a carbon atom that is bonded to two other carbon atoms.The presence of the isopropyl group in 2-propanol gives rise to the peak at 1380 cm -1. This peak is not present in the IR spectra of methanol, ethanol, or 1-propanol because these alcohols do not have an isopropyl group.The
stronger hydrogen bonding in 2-propanol is due to the fact that the hydroxyl group is attached to a carbon atom that is bonded to two other carbon atoms. This makes the hydroxyl group more electron-withdrawing, which in turn makes it more likely to form hydrogen bonds.
Applications of IR Spectroscopy in 2-Propanol Analysis: Ir Spectrum Of 2 Propanol
IR spectroscopy is a powerful tool for analyzing 2-propanol. It can be used to determine the purity of 2-propanol, identify impurities, and characterize its structure.IR spectroscopy can be used to differentiate between different isomers of 2-propanol. For example, IR spectroscopy can be used to distinguish between 1-propanol and 2-propanol.
Purity Determination
IR spectroscopy can be used to determine the purity of 2-propanol by measuring the intensity of the absorption bands corresponding to the functional groups present in the molecule. The presence of impurities will result in additional absorption bands or changes in the intensity of the existing bands.
Identification of Impurities, Ir spectrum of 2 propanol
IR spectroscopy can be used to identify impurities in 2-propanol by comparing the IR spectrum of the sample to the IR spectrum of pure 2-propanol. The presence of impurities will result in additional absorption bands or changes in the intensity of the existing bands.
Structural Characterization
IR spectroscopy can be used to characterize the structure of 2-propanol by identifying the functional groups present in the molecule. The IR spectrum of 2-propanol will show absorption bands corresponding to the O-H stretching vibration, the C-H stretching vibrations, and the C-O stretching vibration.
FAQ Resource
What are the key functional groups present in 2-propanol?
The IR spectrum of 2-propanol reveals the presence of an O-H stretching band, indicating the presence of an alcohol functional group. Additionally, C-H stretching bands confirm the presence of aliphatic hydrocarbons.
How does the IR spectrum of 2-propanol differ from that of other alcohols?
The IR spectrum of 2-propanol exhibits a unique pattern of IR bands due to its secondary alcohol structure. The O-H stretching band is broader and shifted to a lower frequency compared to primary alcohols, reflecting the steric hindrance around the hydroxyl group.
What are the applications of IR spectroscopy in 2-propanol analysis?
IR spectroscopy is widely used in the analysis of 2-propanol for purity determination, identification of impurities, and structural characterization. It can also be used to differentiate between different isomers of 2-propanol.
